
E002 — Perception benchmark
Summary / the selected 9B baseline
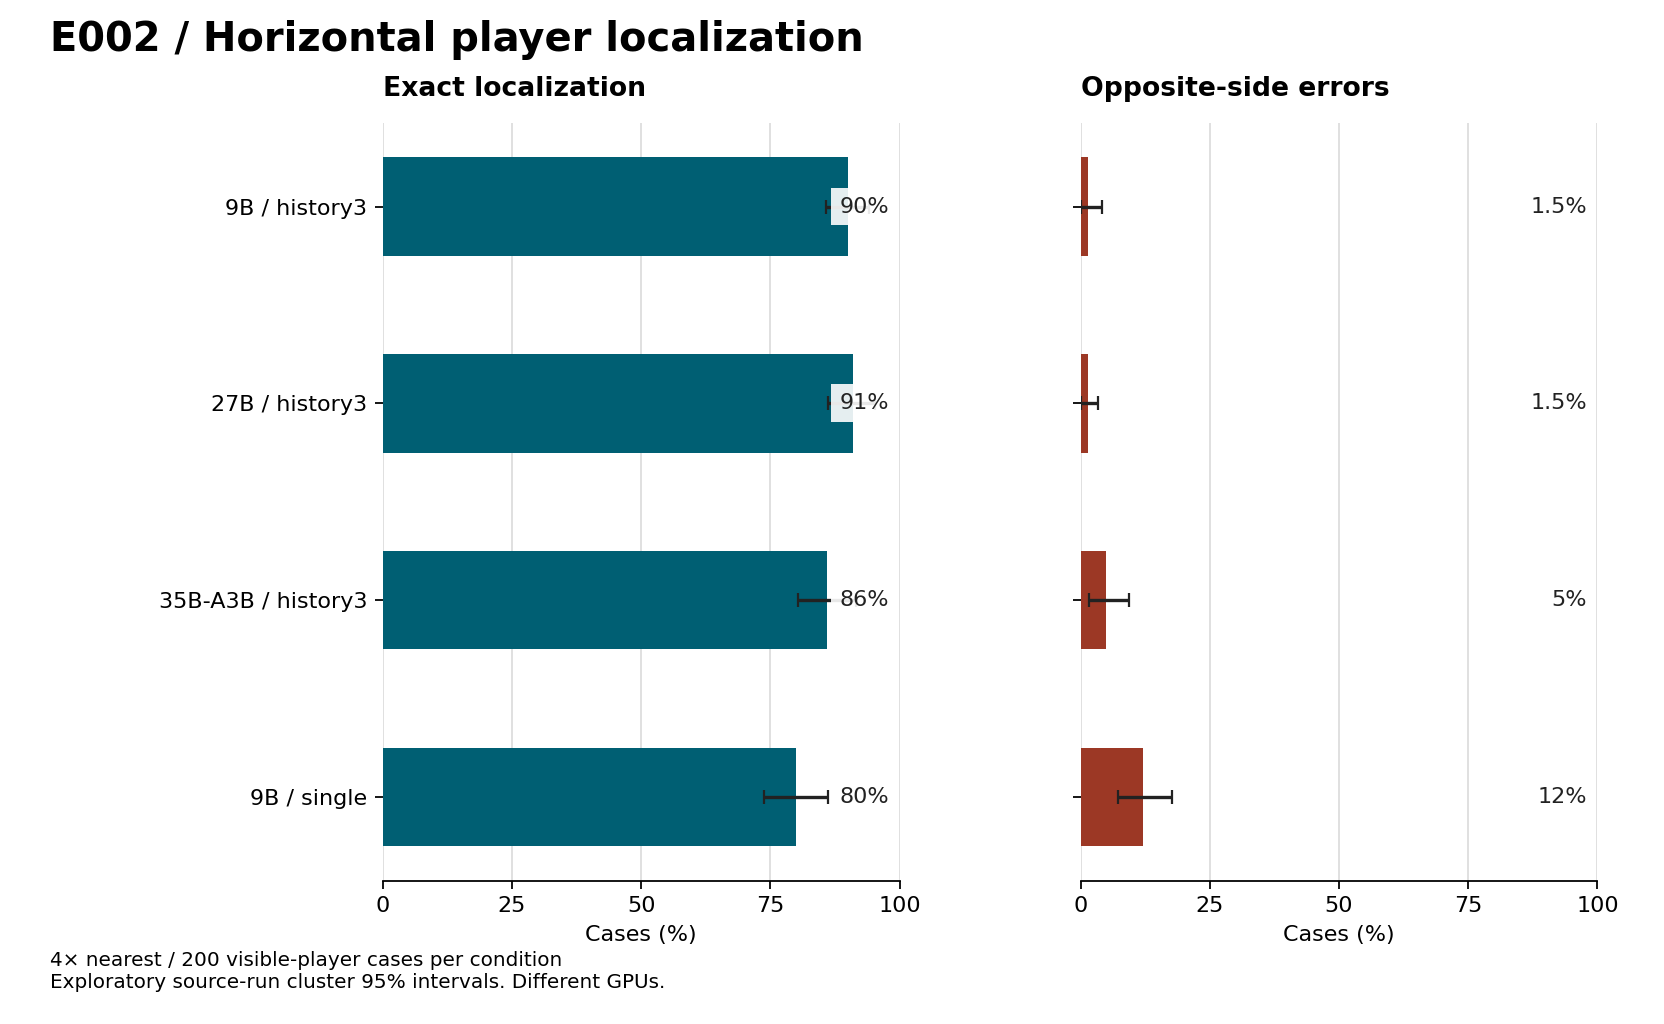
9B + history3 + nearest4 → 90% Exact / 1.5% Opposite. The same model with a single 4× frame measured 80% Exact and 12% Opposite. These are horizontal player-localization results, not gameplay scores.
A balanced, independently labelled benchmark tests horizontal player localization under different visual conditions.
200 game frames · 24 conditions · 4,800 completed inferences
| Model / input | Exact / 95% CI | Adjacent | Opposite | Median latency |
|---|---|---|---|---|
| Qwen 3.5 9B 4× nearest-neighbour + 3-frame history | 90% 85.9–94.1% | 8.5% | 1.5% | 1.984 s |
| Qwen 3.5 27B 4× nearest-neighbour + 3-frame history | 91% 86.2–95.2% | 7.5% | 1.5% | 4.390 s |
| Qwen 3.5 35B-A3B 4× nearest-neighbour + 3-frame history | 86% 80.3–91.5% | 9% | 5% | 4.031 s |
| Qwen 3.5 9B 4× nearest-neighbour, single frame | 80% 73.7–86.1% | 8% | 12% | 0.938 s |
Validated checkpoint: 2026-10-05. Data last synchronized: .
Latest record verified from reviewed published run evidence. Registry counts retain the last full dataset checkpoint; record publication does not refresh the complete dataset. This is a snapshot, not a live counter.
Registry count checkpoint: 2026-10-05T08:28:16.420013+00:00. The latest reviewed record and its evidence update separately from full dataset totals.
Accuracy, error severity and latency
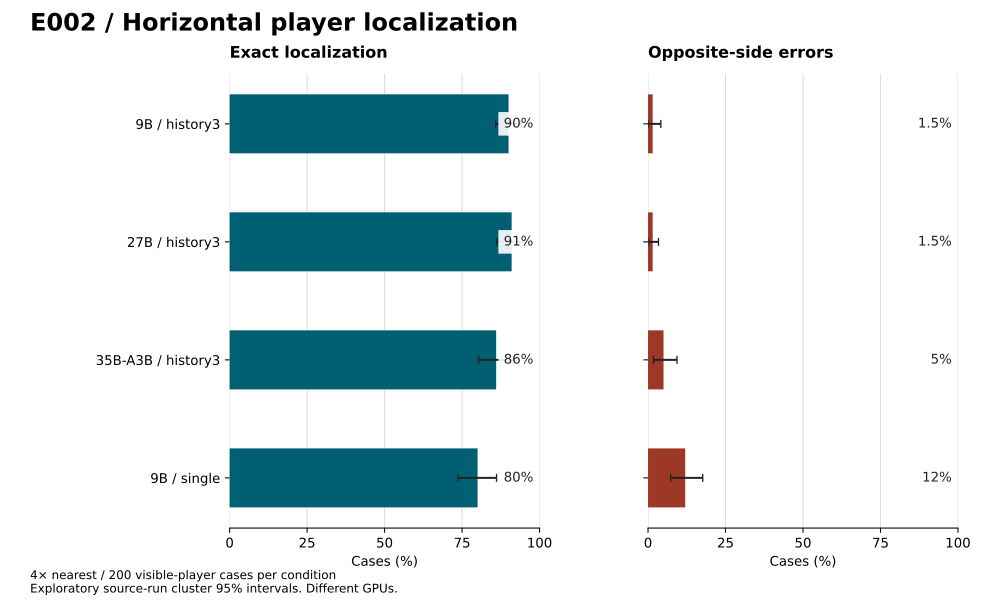
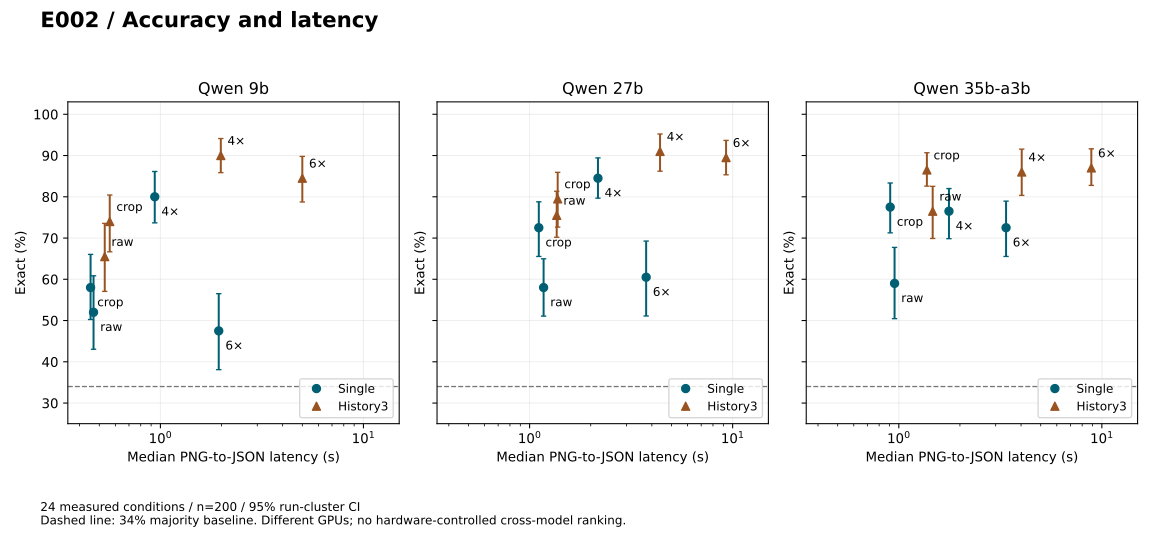
Chart provenance · Baseline SVG · PNG
Why Opposite matters
Exact means the predicted horizontal column is correct. Adjacent is a one-column error. Opposite is a left↔right swap. A wrong side could mislead a controller, but this benchmark does not measure collisions or deaths: Opposite is a localization failure, not a verified gameplay catastrophe.
Adding three-frame context reduced observed left/right swaps from 24/200 (12%) to 3/200 (1.5%). The paired difference is −10.5 percentage points, with an exploratory source-run cluster 95% interval of −15.6 to −6.2. Exact improved by +10.0 points, interval +4.1 to +16.4. Both conditions use the same 200 cases.
All four selected conditions’ Opposite errors were right→left in this sample. That pattern does not establish a general directional bias or a collision mechanism.
Complete results and paired comparisons
All 24 conditions / full measured table
| Model / input | Exact / 95% CI | Adjacent | Opposite | Invalid | Median / p95 latency |
|---|---|---|---|---|---|
| qwen3.5:27b history3 / crop | 79.5% 72.6–85.9% | 13.5% | 7.0% | 0 / 200 | 1.375 / 1.422 s |
| qwen3.5:27b history3 / nearest4 | 91.0% 86.2–95.2% | 7.5% | 1.5% | 0 / 200 | 4.390 / 4.453 s |
| qwen3.5:27b history3 / nearest6 | 89.5% 85.3–93.7% | 7.0% | 3.5% | 0 / 200 | 9.282 / 9.375 s |
| qwen3.5:27b history3 / raw | 75.5% 70.2–81.3% | 12.5% | 12.0% | 0 / 200 | 1.360 / 1.391 s |
| qwen3.5:27b single / crop | 72.5% 65.5–78.8% | 15.0% | 12.5% | 0 / 200 | 1.110 / 1.141 s |
| qwen3.5:27b single / nearest4 | 84.5% 79.7–89.4% | 6.0% | 9.5% | 0 / 200 | 2.171 / 2.298 s |
| qwen3.5:27b single / nearest6 | 60.5% 51.1–69.3% | 17.0% | 22.5% | 0 / 200 | 3.750 / 3.861 s |
| qwen3.5:27b single / raw | 58.0% 51.1–65.0% | 11.5% | 30.5% | 0 / 200 | 1.172 / 1.219 s |
| qwen3.5:35b-a3b history3 / crop | 86.5% 82.6–90.7% | 12.5% | 1.0% | 0 / 200 | 1.375 / 1.469 s |
| qwen3.5:35b-a3b history3 / nearest4 | 86.0% 80.3–91.5% | 9.0% | 5.0% | 0 / 200 | 4.031 / 4.063 s |
| qwen3.5:35b-a3b history3 / nearest6 | 87.0% 82.8–91.6% | 10.0% | 3.0% | 0 / 200 | 8.875 / 8.922 s |
| qwen3.5:35b-a3b history3 / raw | 76.5% 69.9–82.5% | 8.0% | 15.5% | 0 / 200 | 1.468 / 1.516 s |
| qwen3.5:35b-a3b single / crop | 77.5% 71.3–83.3% | 19.5% | 3.0% | 0 / 200 | 0.907 / 1.000 s |
| qwen3.5:35b-a3b single / nearest4 | 76.5% 69.8–82.0% | 11.5% | 12.0% | 0 / 200 | 1.766 / 1.845 s |
| qwen3.5:35b-a3b single / nearest6 | 72.5% 65.5–78.9% | 12.5% | 15.0% | 0 / 200 | 3.375 / 3.453 s |
| qwen3.5:35b-a3b single / raw | 59.0% 50.5–67.7% | 16.0% | 25.0% | 0 / 200 | 0.953 / 1.031 s |
| qwen3.5:9b history3 / crop | 74.0% 66.7–80.4% | 20.5% | 5.5% | 0 / 200 | 0.563 / 0.625 s |
| qwen3.5:9b history3 / nearest4 | 90.0% 85.9–94.1% | 8.5% | 1.5% | 0 / 200 | 1.984 / 2.032 s |
| qwen3.5:9b history3 / nearest6 | 84.5% 78.7–89.8% | 11.0% | 4.5% | 0 / 200 | 5.000 / 5.125 s |
| qwen3.5:9b history3 / raw | 65.5% 57.1–73.5% | 15.0% | 19.5% | 0 / 200 | 0.532 / 0.609 s |
| qwen3.5:9b single / crop | 58.0% 50.2–66.0% | 23.5% | 18.5% | 0 / 200 | 0.453 / 0.516 s |
| qwen3.5:9b single / nearest4 | 80.0% 73.7–86.1% | 8.0% | 12.0% | 0 / 200 | 0.938 / 0.985 s |
| qwen3.5:9b single / nearest6 | 47.5% 38.1–56.5% | 23.5% | 29.0% | 0 / 200 | 1.938 / 2.000 s |
| qwen3.5:9b single / raw | 52.0% 43.0–60.9% | 19.0% | 29.0% | 0 / 200 | 0.468 / 0.516 s |
Download the complete table / CSV · Full original report / JSON · 200 case annotations / JSON
Paired comparisons / 30 within-model contrasts
| Condition / baseline | Exact gain / 95% CI | Opposite difference / 95% CI |
|---|---|---|
| qwen3.5:27b / history3 / crop same-mode raw | +4.0 -3.3 to +10.8 | -5.0 -10.2 to +0.0 |
| qwen3.5:27b / history3 / crop same-variant single | +7.0 +0.5 to +14.6 | -5.5 -10.9 to -0.5 |
| qwen3.5:27b / history3 / nearest4 same-mode raw | +15.5 +9.3 to +21.0 | -10.5 -14.9 to -6.1 |
| qwen3.5:27b / history3 / nearest4 same-variant single | +6.5 +0.6 to +12.1 | -8.0 -12.6 to -3.9 |
| qwen3.5:27b / history3 / nearest6 same-mode raw | +14.0 +8.1 to +19.6 | -8.5 -12.9 to -4.1 |
| qwen3.5:27b / history3 / nearest6 same-variant single | +29.0 +20.4 to +38.5 | -19.0 -25.6 to -13.2 |
| qwen3.5:27b / history3 / raw same-variant single | +17.5 +10.3 to +24.8 | -18.5 -25.5 to -11.7 |
| qwen3.5:27b / single / crop same-mode raw | +14.5 +5.4 to +22.9 | -18.0 -25.7 to -10.1 |
| qwen3.5:27b / single / nearest4 same-mode raw | +26.5 +21.1 to +32.2 | -21.0 -27.5 to -15.0 |
| qwen3.5:27b / single / nearest6 same-mode raw | +2.5 -5.2 to +8.8 | -8.0 -13.6 to -2.7 |
| qwen3.5:35b-a3b / history3 / crop same-mode raw | +10.0 +4.0 to +16.7 | -14.5 -20.4 to -8.9 |
| qwen3.5:35b-a3b / history3 / crop same-variant single | +9.0 +3.3 to +15.6 | -2.0 -4.6 to +0.0 |
| qwen3.5:35b-a3b / history3 / nearest4 same-mode raw | +9.5 +3.4 to +16.1 | -10.5 -15.3 to -6.3 |
| qwen3.5:35b-a3b / history3 / nearest4 same-variant single | +9.5 +2.6 to +16.9 | -7.0 -12.5 to -2.3 |
| qwen3.5:35b-a3b / history3 / nearest6 same-mode raw | +10.5 +4.8 to +17.2 | -12.5 -17.7 to -7.8 |
| qwen3.5:35b-a3b / history3 / nearest6 same-variant single | +14.5 +8.3 to +20.9 | -12.0 -17.3 to -7.6 |
| qwen3.5:35b-a3b / history3 / raw same-variant single | +17.5 +9.8 to +25.8 | -9.5 -15.4 to -3.8 |
| qwen3.5:35b-a3b / single / crop same-mode raw | +18.5 +11.3 to +25.9 | -22.0 -30.0 to -15.1 |
| qwen3.5:35b-a3b / single / nearest4 same-mode raw | +17.5 +10.7 to +24.2 | -13.0 -19.5 to -6.6 |
| qwen3.5:35b-a3b / single / nearest6 same-mode raw | +13.5 +7.2 to +19.9 | -10.0 -15.8 to -4.7 |
| qwen3.5:9b / history3 / crop same-mode raw | +8.5 +0.4 to +16.6 | -14.0 -20.3 to -7.8 |
| qwen3.5:9b / history3 / crop same-variant single | +16.0 +8.5 to +23.0 | -13.0 -19.8 to -6.2 |
| qwen3.5:9b / history3 / nearest4 same-mode raw | +24.5 +16.7 to +33.2 | -18.0 -23.9 to -12.8 |
| qwen3.5:9b / history3 / nearest4 same-variant single | +10.0 +4.1 to +16.4 | -10.5 -15.6 to -6.2 |
| qwen3.5:9b / history3 / nearest6 same-mode raw | +19.0 +11.0 to +27.5 | -15.0 -20.7 to -10.0 |
| qwen3.5:9b / history3 / nearest6 same-variant single | +37.0 +29.1 to +46.1 | -24.5 -31.7 to -18.1 |
| qwen3.5:9b / history3 / raw same-variant single | +13.5 +6.8 to +20.6 | -9.5 -14.5 to -4.9 |
| qwen3.5:9b / single / crop same-mode raw | +6.0 +0.5 to +12.0 | -10.5 -15.6 to -6.2 |
| qwen3.5:9b / single / nearest4 same-mode raw | +28.0 +21.5 to +35.0 | -17.0 -22.7 to -11.7 |
| qwen3.5:9b / single / nearest6 same-mode raw | -4.5 -11.3 to +1.8 | +0.0 -2.8 to +2.7 |
The original JSON also includes all 16 model-versus-9B paired comparisons, confusion matrices, error intervals and prefill/encoding timing. Source SHA-256: 27d0705c2fcb90cbd968ef86118ee870125d3d6d3853894b0dc37d9bd9487aea.
Dataset and bootstrap method
The 200 distinct current frames come from 71 source games. The ship is visible in every case: 66 left, 66 centre, 68 right. Independent pixel matching with two reference appearances, followed by visual audit, supplies ground truth. No annotation markers are passed to Qwen. The majority horizontal baseline is 34%; every ship is vertically bottom, so a 100% vertical score is non-discriminating.
The 24 conditions combine three models, single-frame or history3 input, and raw, nearest4, nearest6 or cropped presentation. Frames are 208×256; history offsets are −12/−6/0 emulated frames. Context is 8,192, temperature 0, seed 2002, maximum output 64 tokens and thinking disabled. Median and p95 latency include all requests, including cold loads.
Intervals use 2,000 bootstrap resamples, seed 2002, clustered by source_run_id. Each resampled game retains all its cases; proportions remain case-weighted. Paired comparisons retain both predictions for each case. Reported intervals are percentile 2.5/97.5, exploratory, with no multiplicity correction. They do not prove equivalence or rare-event safety. Error-severity and model-versus-9B contrasts are secondary analyses.
Limits and the next controlled experiment
9B, 27B and 35B-A3B ran on different GPUs; cross-model latency is not hardware-controlled. Frame selection excludes missing or occluded ships, and the detector-development material overlaps the source material. This is not a fully independent held-out gameplay test. Enemies, bullets, trajectories and safe direction are not evaluated here.
The reviewed original JSON/JSONL and coordinate annotations are available through Downloads. Game images and extracted visual reference assets are withheld. Thus the numerical analysis is inspectable, while reproducing new model calls requires separately supplied lawful images and dependencies. No controller improvement is inferred without a new controlled gameplay cohort.